
PLANTEUR tests how satellite AI handles tropical crops

Ai2’s October 22 writeup details PLANTEUR, a crop mapping benchmark that tests whether satellite AI can work beyond familiar agricultural landscapes. The dataset release commit is dated October 20, following an earlier code commit. It covers six French overseas territories rather than metropolitan France. This is an evaluation resource, not a new foundation model or a live farming service.
The useful question is not simply which model wins a table. It is whether a system that recognizes crops in familiar locations can still identify them somewhere with different terrain, crop distributions and growing seasons. Ai2’s announcement positions PLANTEUR as a tropical counterpart to the established PASTIS benchmark.
What researchers can download
The public repository describes 2,750 satellite image sequences and 47,256 agricultural parcels. Sentinel 2 optical imagery, Sentinel 1 radar and Landsat 8 observations share aligned footprints. The labels distinguish seven crop classes plus background, with excluded classes marked separately rather than treated as ordinary negatives.
Coverage includes Réunion, Guadeloupe, Martinique, Guyane, Mayotte and a small Saint Martin sample. The observations span September 2018 through December 2019. That historical coverage matters. A release in 2026 does not make these labels a current inventory of what farmers are growing.
The full download is approximately 258 GB, including observation arrays, monthly mosaics and precomputed embeddings. Existing PASTIS workflows provide a starting point, but migration is not entirely automatic. Landsat needs the supplied loader, and PASTIS R workflows must account for PLANTEUR combining radar orbit directions into one series.
A harder test of geographic transfer
The technical report compares supervised models, frozen feature probes and adapted foundation models. Its test that withholds an entire territory is especially relevant to deployment. Methods retained roughly 55 to 70 percent of their performance on familiar regions, measured with mean intersection over union rather than a blanket measure of accuracy.
That metric measures overlap between predicted and reference areas for each class before averaging. The result is a warning against treating a strong score on familiar geography as evidence that a crop mapper will transfer unchanged. It does not establish how every satellite model will perform in every tropical country.
The paper also identifies limits in the labels themselves. Farmers outside the relevant agricultural reporting system can be missing. Some crops have too few samples, while other varieties share broad categories. Seasonal crop changes and growing seasons that differ between hemispheres introduce further uncertainty. The benchmark widens evaluation coverage without making it comprehensive.
Read the split rules before comparing scores
The dataset card documents details that can change an experiment. In the standard split, 592 parcels have pixels in more than one partition. In the territory transfer protocol, training and validation share spatial blocks, which can make validation optimistic even though the held out test territory remains separate.
Saint Martin contributes only six patches and is never the held out territory. Mayotte is the smallest test fold. Results therefore need their geographic context, rather than being presented as equally strong evidence across all six places.
Researchers must also exclude void labels from training losses and metrics. Missing Landsat months and missing embeddings need explicit handling. The card provides the fixed experimental subsets and metadata needed to reproduce these choices instead of silently replacing them with a different evaluation.
That distinction complements our coverage of OlmoEarth satellite embeddings. An embedding product supplies features for analysis. A benchmark supplies labels and protocols for checking whether those features work for a particular mapping task.
An evaluation tool rather than a deployment guarantee
The repository distinguishes its MIT licensed code from the dataset, distributed under ODC BY. Source attribution and the separate terms attached to embedding products still matter. A software license alone is not permission to ignore the data’s conditions.
For teams choosing satellite AI, PLANTEUR offers a concrete way to test a geographic weakness before deployment. The sensible comparison reports the protocol, region and missing data handling alongside the score. A useful benchmark makes those qualifications visible rather than hiding them behind a single ranking.
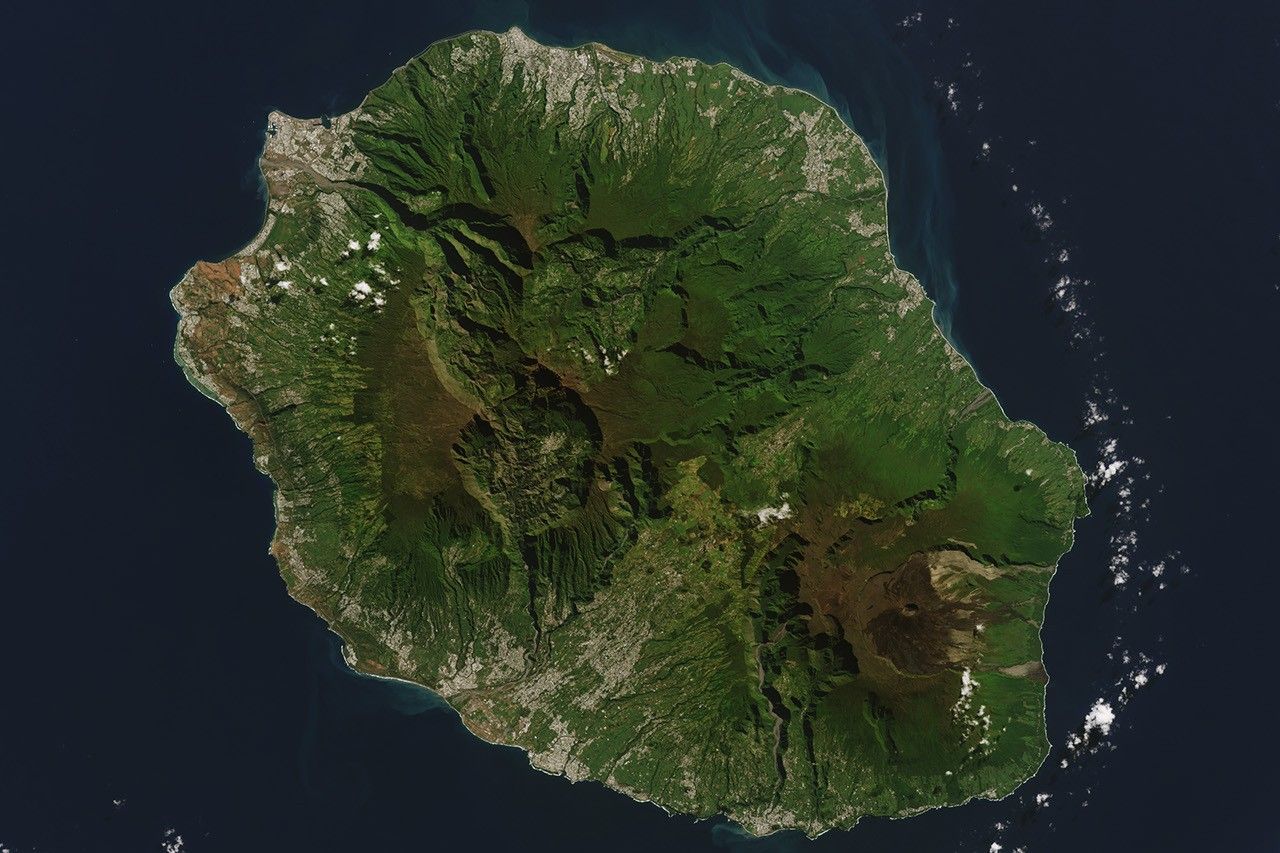
Featured image shows Réunion in a Landsat 8 observation from May 23, 2022. It is archival regional context, not PLANTEUR output. Image credit NASA Earth Observatory / Wanmei Liang, using USGS Landsat data. Image source.